In need of a hard truth 🔮
During my years as a researcher within design teams I have often seen clients and stakeholders eagerly looking for anything that will allow them to make confident product decisions. That’s especially true when it comes to assessing designs, as they’re often seen as a subjective interpretation of a solution.
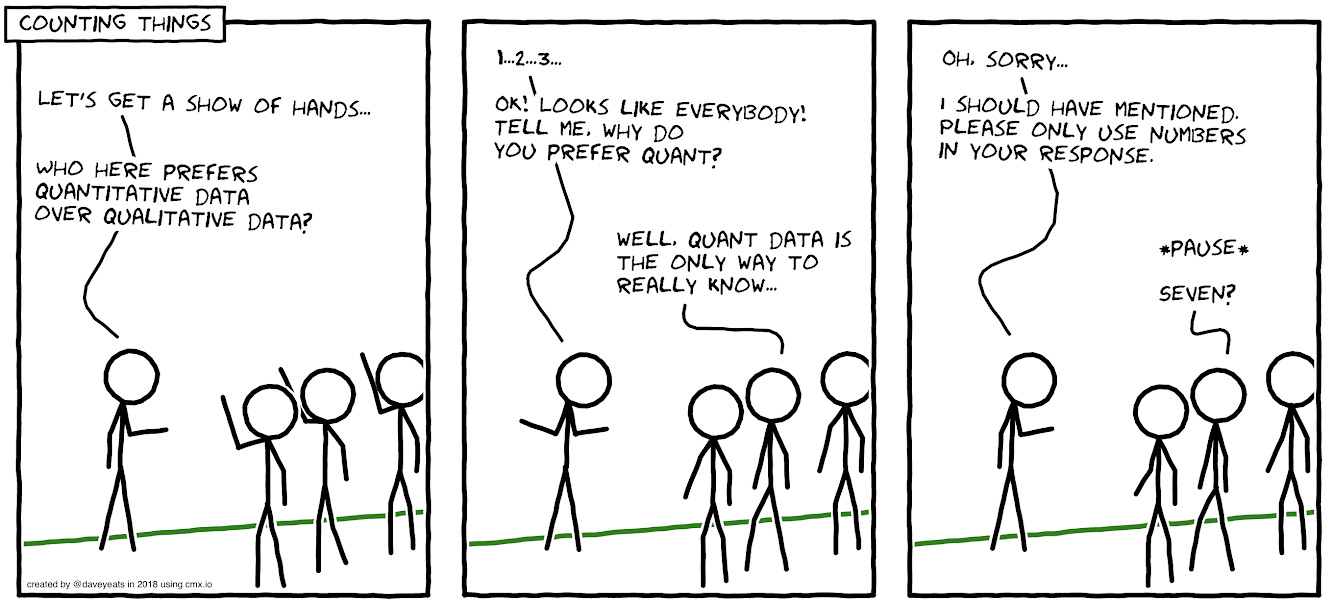
This need, in combination with the democratisation of (big) data has led to teams all around the world using numerical data as the most reliable way to inform decisions. Big Data and analytics are “hard facts” and presumably serve as the indisputable basis for making objective product decisions whereas ‘traditional’ research’ is seen as offering ‘softer’ data.
Here’s a quote I found online that kind of sums this up:
“Metrics are the internet’s heroin and we’re a bunch of junkies mainlining that black tar straight into the jugular of our organizations. They make our products easy to quantify. They attach something concrete onto the inherently mushy experience visitors go through when using our digital doohickies.” Louder than ten
The answer is not in the data 🤥
You might think that that’s a controversial statement, especially coming from a researcher (and yes, it is a bit clickbaity 🥸 ), but we can’t and shouldn’t let data take our decisions for us. Data, qualitative or quantitative, can only give us direction and inspiration. There’s no piece of data that will get you to the truth because there’s no such thing as an objective truth. And that is mainly because all data are gathered, analysed, synthesised and modeled by humans and humans carry biases (more on biases in another instalment).
So, what can we do to make sure that the decisions we make based on our data are solid?
Triangulate to dig deeper 📐🪆
Many times I’ve had discussions with clients, stakeholders and team members about which type of data is better, quantitative or qualitative. And it’s a conversation that can, nerdily, become quite heated. The answer is...none. No type of data is better than the other because they do different things and answer different questions. All types gather behavioural data to try and predict, map and anticipate human actions but, generally speaking, qualitative research explores what people think, feel and do while quantitative research gives a measure of how many people think, feel or behave in a certain way. Quantitative methods provide a ‘big picture’ of the current situation but fail to explain the reasons behind the measured scores. On the other hand, qualitative methods have the capacity to unveil the reasons behind the outcomes but struggle to provide the ‘big picture’.
For example, if in one of your forms you have a high dropout rate in one of the steps you won’t be able to know why your users drop off at that point unless you observe them trying to fill in that form in some type of interview setting.
Mix your methods🍹
Trust me, I understand how dangerously close I am to a dad joke by calling this a research cocktail 😅, the research community and academia calls ‘Mixed methods research and in my experience, it gives you the most enlightening results. Next time you want to predict or explain user behaviour (and time and budget allows) try to think how you can get more than one type of data or how you can use multiple methods to get a more complete picture and I promise you you won’t be disappointed.
If you’re keen to understand more about the different types of data and how they can help, here’s a quick video:
Can’t wait to meet more of you over the next couple of weeks!
Have an amazing weekend,
Spyri


